


What Students Say About Our MS Excel Assignment Help
Why Students Trust Our MS Excel Assignment Help
-
Formulas That Actually Work A formula that returns the wrong result is worse than no formula at all because it looks correct until someone checks the output against the source data. We build every formula around the right logic for your specific task, test it against your data, and make sure it returns accurate results consistently across every row and scenario your brief includes. No hardcoded shortcuts, no approximate workarounds dressed as solutions. Every formula in your spreadsheet is correct and traceable back to a clear, legitimate calculation method.
-
Real Excel Proficiency Excel proficiency beyond basic arithmetic means knowing when to use VLOOKUP versus INDEX MATCH, how to build dynamic named ranges, when an array formula solves a problem nothing else can, and how to structure a workbook so it does not break when new data is added. Our experts bring that level of knowledge to your brief. Visit our meet our team page to see who handles your Excel brief before you place your first order with us today.
-
Financial and Data Analysis Excel assignments span financial modelling, data analysis, statistical work, business reporting, and management accounting tasks that each require a different approach to how your workbook is structured, what formulas you use, and how your output is presented. We match our approach to the specific type of Excel task your brief requires rather than applying one generic spreadsheet style to every order. For students whose Excel work feeds into broader accounting submissions, our accounting assignment help covers the financial analysis context behind the numbers your spreadsheet is built to calculate and present.
-
Clean, Original Workbooks Every Excel workbook we produce is built from scratch around your specific dataset, brief requirements, and course level. No recycled workbooks, no template files populated with your data. Excel assessments are specific enough that reused work is identified immediately when your formulas reference the wrong cells or your pivot table structure does not match the analytical question your brief is asking you to answer. A free originality report comes with every order to confirm this before you submit your completed work.
1.1M+
Orders
4.9/5
Rating
0%
AI Usage
Don't Just Take Our Word For It...
We have delivered over 1,116,250+ unique orders with a consistent 4.9/5 satisfaction rate across all subjects.
Real MS Excel Assignments We Have Helped Students Complete
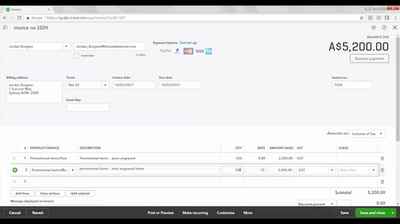
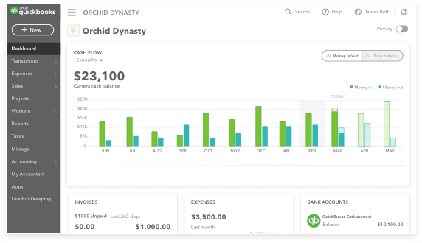
Financial models, pivot analyses, interactive dashboards. See spreadsheets built the way they should have been from the very first cell.






How Ms Excel Help Works
Get your Ms Excel solution in 4 simple steps
 1
1
Submit Details
Fill out the order form with your assignment requirements.
 2
2
Get Fast Quote
Receive a competitive price quote via email within minutes.
 3
3
Secure Pay
Confirm your order using our safe & encrypted payment gateway.
 4
4
Receive File
Download your 100% human-written, plagiarism-free solution.
Frequently Asked Questions About MS Excel Assignment Help
Expert answers to common queries about our Ms Excel services.
What types of MS Excel assignments can you help with?
We cover financial modelling, pivot tables and data analysis, lookup formulas, charts and dashboards, statistical analysis, management accounting spreadsheets, and data cleaning tasks. Whether your brief focuses on one specific Excel feature or requires a complete multi-sheet workbook built from scratch, we handle every component accurately. Browse our work samples page to see real examples of our Excel work before sending your own brief to us today.
Can you help if my formulas are returning errors I cannot fix?
Yes. Formula errors in Excel usually trace back to wrong cell references, mismatched data types, incorrect function syntax, or circular references created by a structural problem in the workbook. We trace through your formula logic systematically, find exactly where the error originates, and fix it correctly so the result is accurate rather than approximately right. Visit our how it works page to see how to share your file and brief with us quickly.
Can you help with pivot tables and data analysis tasks?
Yes. Pivot table setup, grouping, filtering, calculated fields, and slicers are all Excel skills we apply correctly to your specific dataset and analytical question. We make sure your pivot table answers what your brief is actually asking rather than just aggregating your data in a way that looks like analysis without producing meaningful insight. Students whose pivot table data comes from relational database sources can find relevant support through our ms access assignment help for the database side of that data extraction work.
Who works on my MS Excel assignment?
Can you help with Excel dashboards that include slicers and dynamic charts?
Yes. Interactive Excel dashboards with slicers, drop-down controls, dynamically linked pivot charts, and named range-driven formulas are all things we build correctly as part of your dashboard brief. Getting interactivity right in Excel requires the workbook to be structured correctly from the start, not patched together at the end. Students whose dashboard output needs to feed into a formal written report can find document-level support through our ms word assignment help for the written analysis and report formatting that accompanies many Excel dashboard submissions.
How do I know my Excel workbook is original?
Every workbook we produce is built from scratch around your specific brief, dataset, and task requirements. No recycled models, no template files populated with your data. A free originality report is included with every completed order so you can confirm this before submitting. Our full position on academic honesty is clearly explained on our academic integrity page. We apply this standard without exception to every MS Excel brief we handle for every student we support throughout the academic year without compromise.
Can you help with statistical analysis using the Excel Data Analysis ToolPak?
What happens if my completed workbook needs changes?
How is pricing structured for MS Excel assignment help?
Is getting MS Excel assignment help academically acceptable?
What Every MS Excel Assignment Help Order Delivers
Financial Modelling Tasks
Financial models in Excel require a logical workbook structure, correct formula methodology, and clear separation between inputs, calculations, and outputs. A model where assumptions are hardcoded into formulas rather than referenced from a dedicated input section fails the moment any figure changes. We build financial models with the right architecture from the start, applying DCF analysis, scenario modelling, and sensitivity tables correctly. For students whose financial modelling connects to broader corporate finance analysis, our finance assignment help covers the financial theory behind the model your brief requires.
Pivot Tables and Analysis
Pivot tables are one of the most powerful analytical tools in Excel and one of the most frequently misused. Grouping the wrong field, choosing the wrong aggregation, or failing to filter your data correctly produces a pivot table that looks like analysis but does not actually answer the question your brief is asking. We build pivot tables correctly around your specific dataset and analytical objective, apply the right grouping and filtering logic, and present your findings in a format that communicates your results clearly and accurately to whoever is marking your submitted Excel work.
Lookup and Reference Formulas
VLOOKUP, HLOOKUP, INDEX MATCH, XLOOKUP, and OFFSET are all lookup formulas that retrieve data from one part of your workbook based on a reference value in another. Choosing the wrong function or applying it incorrectly returns errors or inaccurate results that cascade through every subsequent calculation built on top of that lookup. We apply the right lookup formula for your specific data structure and brief requirement, test it thoroughly against your dataset, and make sure every referenced value is pulled correctly every time the formula runs.
Charts and Data Visualisation
Excel charts need the right chart type for the data relationship being shown, correct axis scaling, clear labelling, and a title that tells your reader what the chart is actually communicating rather than simply describing the data it plots. We build every chart in your workbook with the right format for your analytical purpose, apply consistent formatting across your full workbook, and make sure each visual element adds genuine insight rather than visual noise. A well-built Excel chart communicates a finding instantly without requiring explanation from the surrounding text in your submission.
Dashboard Design and Build
Excel dashboards combine multiple analytical outputs into one interactive summary view that allows users to explore data through slicers, drop-down controls, and dynamically linked charts and tables. Building a functional Excel dashboard requires correct formula architecture, properly linked pivot tables, and consistent formatting across every connected element. We build your dashboard correctly from the underlying data structure through to the final visual layout. For students whose dashboard work connects to broader business intelligence tasks, our tableau assignment help covers the data visualisation platform that frequently sits alongside Excel in management analytics programs.
Statistical Analysis Tasks
Descriptive statistics, regression analysis, hypothesis testing, correlation, and ANOVA all appear in Excel briefs that sit inside quantitative research, economics, and business analytics modules. We apply the right statistical tools to your specific dataset, use the Excel Data Analysis ToolPak correctly where your brief requires it, and interpret your output in the plain analytical language your brief is asking you to produce. Getting the statistical method right matters as much as getting the Excel execution right, and we bring both to every statistical analysis task we handle.
Management Accounting Spreadsheets
Budgeting models, variance analysis tables, break-even calculators, marginal costing schedules, and overhead absorption workbooks are all management accounting tasks that live in Excel and require both correct accounting logic and clean spreadsheet construction. We build your management accounting spreadsheet with the right cost accounting methodology applied correctly and the right Excel structure to support it, showing all workings clearly and presenting your output in the format your management accounting brief has specified for this specific assessed task within your program.
Human-Built Every Time
Every Excel workbook we produce is built by a real expert who reads your brief carefully and constructs your formulas, pivot tables, charts, and models from scratch around your specific data and task requirements. No template workbooks, no recycled models repopulated with your figures. Excel assessments are specific enough that reused work is identified immediately when cell references, formula logic, or workbook structure does not match the dataset and analytical question your brief provides. See our work on our work samples page before placing your order.
Free Originality Report
A free originality report is included with every completed order as standard. You do not need to request it separately or pay for it as an extra. It confirms your submission is original before it reaches your institution. If you have questions about what we cover before placing your first MS Excel request, our faq page answers the most common things students ask about our process, what to expect from a typical spreadsheet order, and how we handle different types of Excel briefs from brief submission through to final delivery of your completed workbook.
Round-the-Clock Support
Excel errors at inconvenient hours need immediate attention, not a response the next morning. Whether a formula has broken, your pivot table is producing wrong totals, or your dashboard has stopped updating correctly, our team is available any time you need us. Use our ask a question page to get a direct answer before committing to a full order and we will tell you exactly what your brief needs and how quickly we can have your completed Excel workbook ready and delivered to you.
MS Excel Assignment Help for Students Studying Across the World
Microsoft Excel is the most widely used analytical tool in business, finance, accounting, and management programs at universities and colleges worldwide. Students everywhere face the same core challenge: Excel looks approachable until your formula returns an error you cannot trace, your pivot table aggregates incorrectly, or your financial model produces a figure that makes no logical sense. Getting Excel right under the pressure of an academic brief requires genuine spreadsheet knowledge, not just familiarity with the interface. We support students from North America to Southeast Asia and the Middle East with consistent Excel expertise and real attention to what every brief specifically requires at your level of study. Students whose Excel work sits alongside broader software-based or quantitative management tasks can explore our ms power point assignment help and taxation assignment help for support in those closely connected subject areas their management degree program covers throughout the academic year.
Assignment Help in the USA
MS Excel features across finance, accounting, business analytics, and MBA programs at US universities from Chicago Booth and Wharton to state schools across Michigan, Indiana, and North Carolina. Briefs typically combine financial modelling, data analysis, and dashboard construction with written interpretation of results. We help American students produce Excel submissions that meet the rigorous analytical and presentational standards US business programs expect across every formula, model, and chart their specific assessed Excel brief requires.
Assignment Help in the UK
UK universities in Bristol, Southampton, and Edinburgh include MS Excel within finance, accounting, and business analytics programs where spreadsheet proficiency is assessed alongside analytical writing quality. Briefs often require financial models, pivot table analyses, and dashboard outputs alongside written interpretation. We make sure your Excel submission covers every formula, model, and analytical output your UK institution expects, so every assessed component reflects genuine spreadsheet proficiency and analytical depth throughout your specific submitted Excel brief.
Assignment Help Australia
Australian students at universities in Perth, Darwin, and Hobart work through Excel briefs within finance, accounting, and business programs that combine spreadsheet construction with analytical commentary on results. Submissions often require working models alongside written interpretation of outputs. We help students across Australia produce complete, accurate Excel submissions on time, covering every formula, pivot table, chart, and written component their unit coordinator expects in the final workbook and accompanying document they submit for assessment.
Assignment Help Canada
Canadian students at universities in Winnipeg, Halifax, and Regina encounter Excel within accounting, finance, and business analytics programs that combine financial modelling with data analysis and management reporting tasks across different module briefs. We support students across every Canadian province with Excel submissions that reflect genuine spreadsheet proficiency and analytical thinking, meeting the specific formula, model, and presentational requirements their instructor has set for the type and level of Excel brief they have been assigned.
Assignment Help Singapore
Students at NUS, NTU, and Singapore Management University work through Excel briefs within finance and business analytics programs where both spreadsheet construction quality and the analytical insight behind it are closely assessed. Singapore's data-driven academic culture expects Excel work to reflect professional-level proficiency. We help Singapore students produce accurate, well-structured Excel submissions that satisfy demanding marking criteria across every formula, model, dashboard, and analytical output component their specific assessed brief requires throughout.
Assignment Help Malaysia
Malaysian students at Universiti Putra Malaysia, INTI International University, and private business colleges across Kuala Lumpur and Penang work through Excel briefs within finance and business programs that combine financial modelling with data analysis and reporting tasks. We help students across Malaysia produce accurate, well-structured Excel submissions with correct formulas, properly built pivot tables, and the clear analytical output their lecturers expect when assessing spreadsheet work at their specific program and academic level throughout the year.
Assignment Help Hong Kong
Students at HKUST, HKU, and Chinese University work through Excel briefs within finance and business analytics programs that are analytically demanding and expect both spreadsheet construction quality and clear interpretation of the outputs your models and analyses produce. We help Hong Kong students produce accurate, well-structured Excel submissions within tight deadline windows, covering every formula, model, chart, and analytical output component their brief requires so one complex spreadsheet task does not derail your broader academic performance this semester.
Assignment Help Spain
Spanish students studying finance and business administration at universities in Zaragoza, Valencia, and Santander encounter Excel within programs that combine financial modelling with data analysis and management reporting tasks. International students in English-medium programs face the added challenge of engaging with technically demanding spreadsheet briefs in a second language. We provide Excel assignment help that is technically accurate, correctly structured, and aligned with the analytical expectations your Spanish institution sets for assessed spreadsheet work at your program level.
Assignment Help Saudi Arabia
Students at KFUPM, Effat University, and private business colleges in Saudi Arabia work through Excel briefs within finance and business programs that combine financial modelling with data analysis and management reporting tasks. Coursework here often combines standard Excel techniques with analysis of Gulf region financial and operational data. We support Saudi students with accurate, well-structured Excel submissions that meet the technical and analytical expectations their institution sets for assessed spreadsheet work at their specific program level.
Assignment Help Kuwait
Kuwaiti students at Kuwait University and the American University of Kuwait work through Excel briefs within business and finance programs that place increasing emphasis on spreadsheet-based data analysis and financial modelling skills. Balancing Excel coursework with other demanding management modules under genuine time pressure is something many students here manage regularly. We help Kuwait students produce accurate, well-built Excel submissions on time so one formula-intensive brief does not put unnecessary strain on your broader academic performance this semester.
When Spreadsheets Get Serious, Every Subject Needs the Right Numbers Behind It
MS Excel Homework Help
Practicing Excel before your graded submission? We help you build genuine confidence with formulas, pivot tables, charts, and financial models so when your real deadline arrives you are working from solid spreadsheet knowledge rather than trying to learn the tool and complete the brief at exactly the same time under deadline pressure that leaves no room for trial and error.
MS Excel Paper Help
Writing a paper on data analysis methodology, financial modelling practices, or the role of spreadsheet tools in business decision-making? We help you build a focused, well-referenced paper that connects Excel-based analytical techniques to real business applications and outcomes. Strong analytical papers make a clear argument grounded in evidence and we make sure yours does exactly that from the opening argument through to your final conclusions and recommendations throughout the full submitted paper.
MS Excel Thesis Help
A thesis on spreadsheet-based financial modelling, data-driven business decision-making, or Excel adoption in organisational practice needs a research question with genuine practical significance grounded in real evidence. We support you through every chapter, helping you connect existing literature to your specific inquiry and present your findings with the analytical depth your institution expects from someone working at thesis level in this applied and commercially relevant subject area throughout your program..
MS Excel Dissertation Help
A dissertation in financial modelling, business analytics, or data-driven management demands sustained analytical depth and precise academic writing from your research question through to your conclusions. We help you build your research framework, handle your quantitative analysis correctly, and produce a final submission that reflects the original thinking your institution expects from a candidate working at dissertation level in this technically demanding and commercially grounded management subject area.
Accounting Assignment Help
Excel and accounting are deeply connected across management programs. Financial statements, variance analysis, overhead absorption, and management reporting all live in spreadsheets. If your Excel brief involves accounting content or your accounting brief requires Excel modelling, we cover both so every formula reflects the right accounting logic and every figure your spreadsheet produces is grounded in correct accounting treatment rather than calculation mechanics applied without genuine subject understanding throughout your submitted work.
Finance Assignment Help
Financial modelling, DCF analysis, portfolio optimisation, and investment appraisal all require Excel as the primary tool in finance programs worldwide. If your finance brief needs a working Excel model alongside written analysis, we handle both so your model is architecturally sound, your formulas are correct, and your written interpretation explains what the output actually means for the financial decision your brief has asked you to evaluate and present clearly throughout your submission.
Business Assignment Help
Business performance dashboards, sales forecasting models, and market analysis spreadsheets are all Excel tasks that appear inside business management programs. If your business brief requires Excel-based analysis, we bring genuine business knowledge to your spreadsheet content so the analytical decisions behind your model reflect real business logic rather than spreadsheet mechanics applied without understanding the commercial context your brief is actually asking you to engage with throughout your submitted work.
QuickBooks Assignment Help
Excel and QuickBooks work together in many accounting programs, with Excel used for analysis that extends beyond what QuickBooks generates natively. If your coursework spans both tools, we handle both so your QuickBooks data and your Excel analysis are consistent, accurate, and presented correctly across every component of your practical accounting brief. No gaps between what your software records and what your spreadsheet analysis reports back to your instructor in your submitted assessment work.
Operations Assignment Help
Operational data analysis, capacity planning models, inventory management spreadsheets, and supply chain performance dashboards are all Excel tasks that sit inside operations management programs. If your brief involves operational Excel work, we bring both the operations context and the spreadsheet expertise so your model reflects genuine understanding of the operational problem your brief is asking you to analyse and present clearly with supporting data and correctly calculated outputs throughout your submitted work.
Sage Assignment Help
Sage financial data is frequently exported into Excel for further analysis, reporting, and management accounting work that goes beyond what Sage generates natively in its standard reports. If your program uses both Sage and Excel across the same module or adjacent briefs, we support both so your Sage output and your Excel analysis are consistent, accurate, and professionally presented across every component of your practical management accounting and financial reporting coursework submission.
Stop Guessing Why Your Spreadsheet Is Broken
Share your file and brief. Our experts trace the problem, fix the formula, and deliver a workbook where every figure is correct and every output actually answers what your brief is asking for.